What is a carbon footprint?
The exact definition of a carbon footprint has not been agreed but it is often used as an indication of the greenhouse gasses generated by human activities. It is often measured in terms of tCO2eq (tonnes of carbon dioxide equivalent) and can be used to estimate an individual’s or a community’s contribution to climate change.
1. The Impact Community Calculator
Recently we have been looking at the online Impact Community Carbon Calculator – a joint project between the Centre for Sustainable Energy and the Centre for Energy and the Environment at the University of Exeter. They recognize three categories or ‘Scopes’ for footprint investigation. Scope 1 are direct emissions from fuel combustion, Scope 2 are indirect emissions implied from the consumption of electricity and network supplied heating and cooling, and Scope 3 are indirect emissions arising as a consequence of consumption of other goods and services.
Footprints for geographical areas (such as Headingley and Hyde Park Ward) are then calculated using two different methods:
· A Consumption Footprint: includes upstream and downstream emissions from residents’ consumption of manufactured goods, food and their own transport activity, regardless of where the emissions occur, and
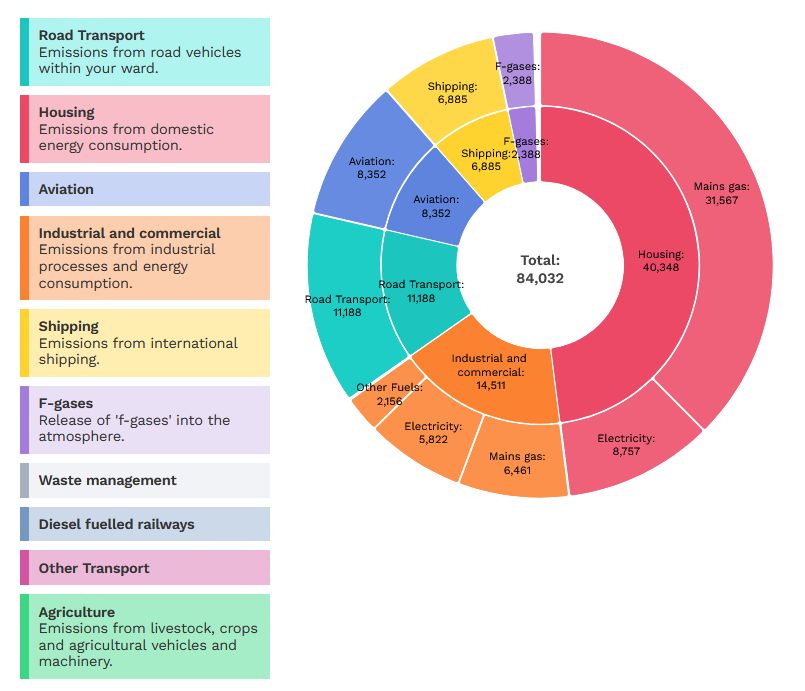
· A Territorial Footprint: includes all emissions that are generated within a defined geographical area, including those from industry, agriculture and transport activities.
A more detailed definition of territorial and consumption-based footprint is given in their methodology paper.
It is well worth looking at the website to see how the footprint for our Ward compares with those for the city and the country.
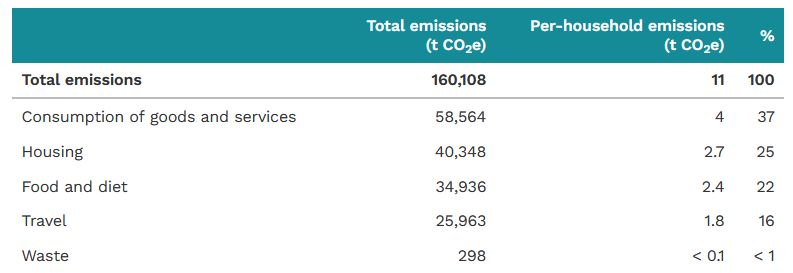
a) Headingley and Hyde Park Consumption Footprint
Here is their breakdown of how the household footprint for the Ward consists of contributions from housing, food consumption, travel and waste management:
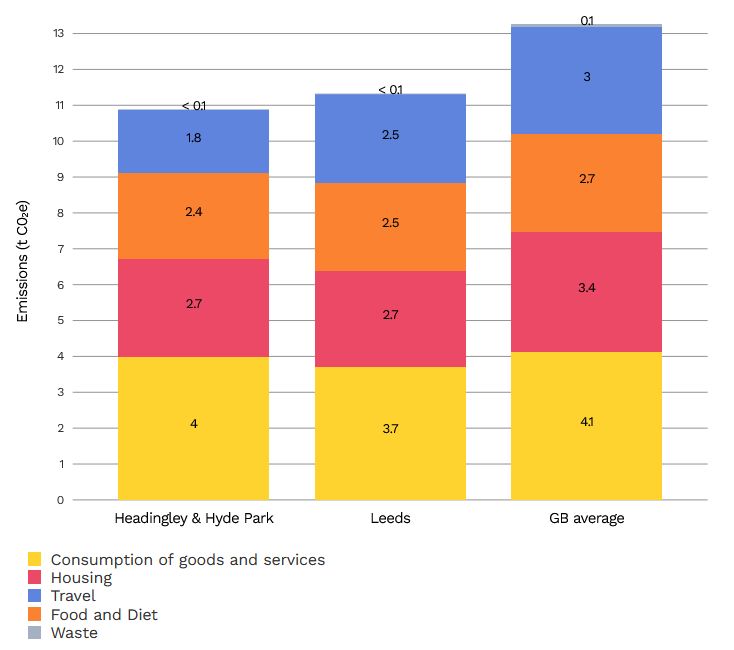
A comparison of how the Ward average compares with district and national figures is shown below:
Some of these figures are rough approximations as they are difficult to calculate for a particular territory. As a consequence some are calculated for the whole country and apportioned to each ward based on its population.
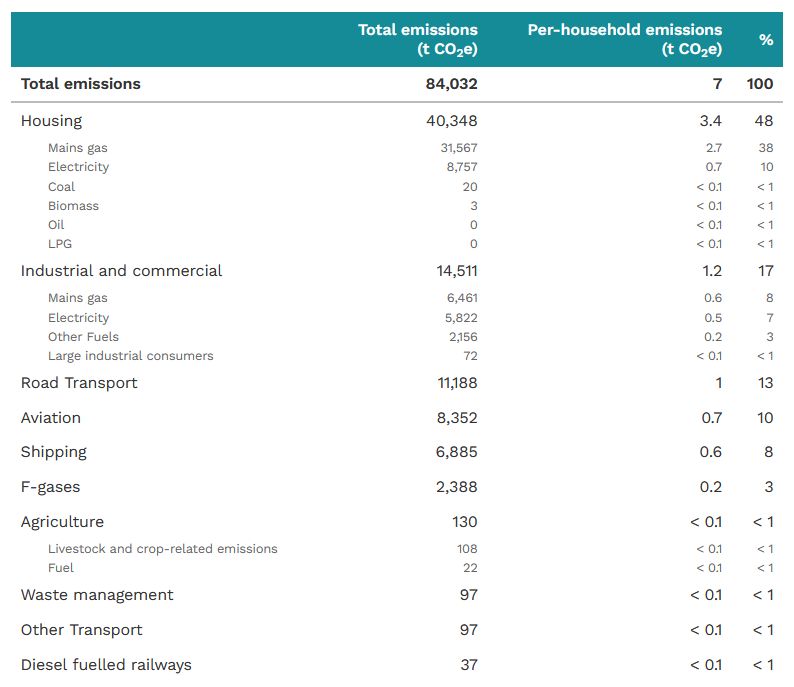
Here is a table of the numbers for total and per household averages:
Some suggestions for things to consider include:
- Who are the key stakeholders you would need to engage with to address the emissions from the highest emitting sectors?
- For example – for agricultural emissions can you engage with local land owners, or the NFU/other farmer groups to understand what is happening in your area to reduce emissions from agriculture? For industrial and commercial emissions, are there ways that businesses could be supported with reducing their emissions? For road transport what changes would be needed to improve public and active travel links?
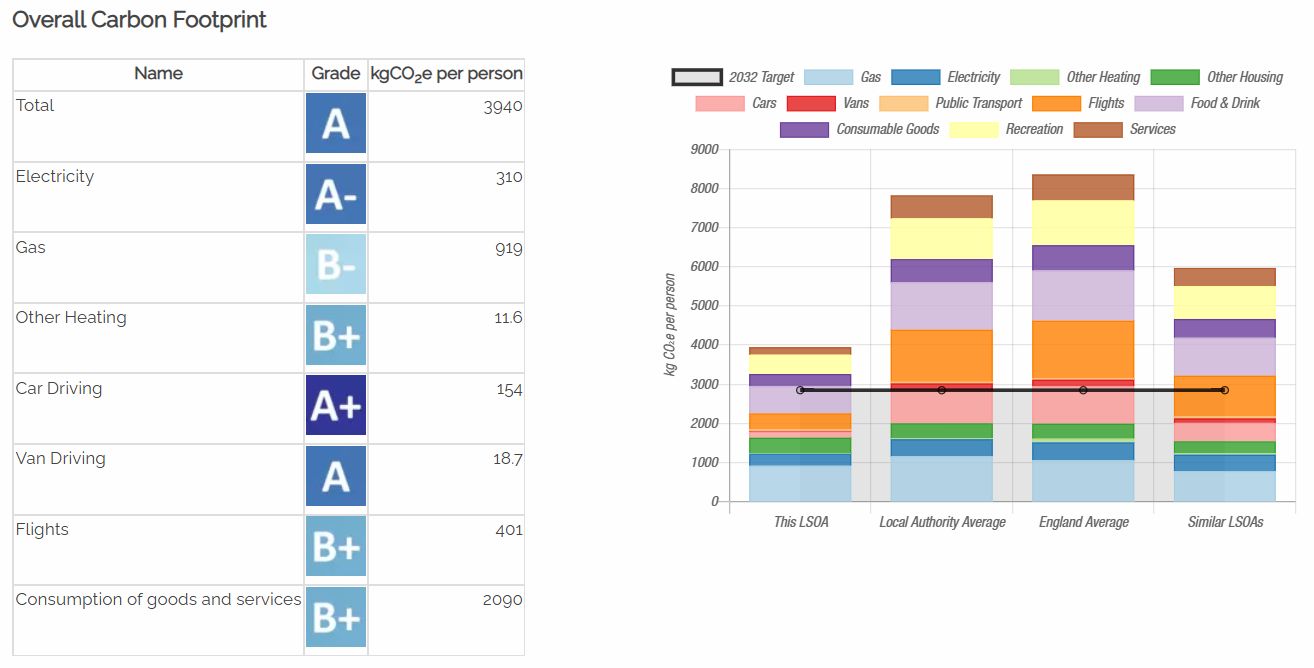
2. Place-based Carbon Calculator
There is another online tool available – the Place-Based Carbon Calculator, developed by a CREDS researcher based in Leeds. The average footprint they obtain for people living in the Ward is shown blow and compared with the national, Local Authority and similar areas. The Ward seems to be doing quite well in this picture but even with these estimates we still have a long way to go to hit the black line – the 2032 target for us to avoid climate catastrophe.